Availability:
The Forecast Accuracy Tracking feature is available with the following HubSpot subscriptions:
- Sales Hub – Professional, Enterprise
- Service Hub – Professional, Enterprise
Accurate forecasting is essential for identifying trends, optimizing sales strategies, and improving forecast reliability. HubSpot’s Forecast Accuracy Tracking feature allows managers to measure the effectiveness of their team’s forecasts, helping them coach sales reps more effectively, while reps gain greater visibility into their own performance.
By regularly monitoring forecast accuracy, teams can refine their sales predictions, leading to more precise revenue expectations and better goal attainment.
Tracking Forecast Accuracy in HubSpot
HubSpot provides built-in tools to analyze and measure how close your team’s submitted forecasts are to actual closed revenue.
Steps to Track Forecast Accuracy:
- Navigate to Reporting > Forecast in your HubSpot account.
- In the Forecast submission column, click the edit pencil icon next to the user or team whose forecast accuracy you want to track.
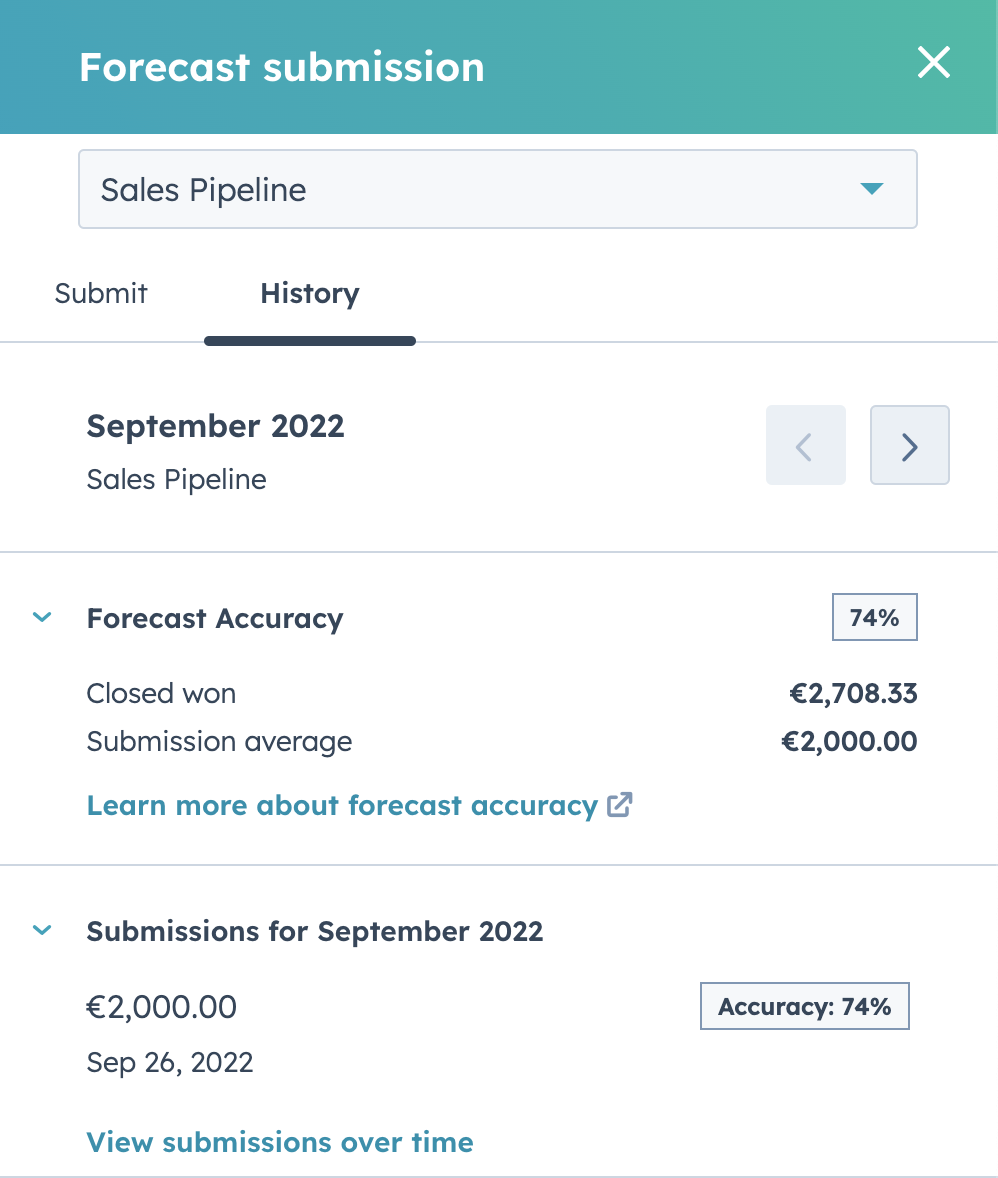
- In the right panel, click View history.
- Select the Pipeline and Forecast period (must match your forecast settings).
- Use the <, > arrows to adjust the time period (view up to one year of historical data).
- In the Forecast Accuracy section, review key performance indicators.
Understanding Forecast Accuracy Metrics
HubSpot provides three core metrics for measuring forecast accuracy:
1. Forecast Accuracy Score
Calculated using the following equation:
- Max = (0, 1 −Forecast Error Percentage)
- Forecast Error Percentage = (∣Actual - Forecast| / Actual) ×100
- If the forecast error percentage is greater than 1, the accuracy score will always be 0.
💡 Example: If your forecasted revenue was $50,000 and actual revenue was $55,000, the forecast error percentage would be 9%, meaning the accuracy score is 91%.
2. Closed Won Revenue
This metric reflects the total amount of revenue from deals marked as "Closed Won" during the selected time period.
- Helps managers compare actual performance vs. forecasted expectations.
- Useful for identifying whether sales reps are overestimating or underestimating their forecasts.
3. Submission Average
This is the average of all forecast submissions made for the selected period.
- Provides insight into how consistent or fluctuating forecast submissions are over time.
- Helps identify trends in forecasting behavior, such as whether reps frequently revise their predictions closer to the deadline.
Why Forecast Accuracy Matters
- For Managers: Gain insights into how well your team is forecasting and identify areas where additional coaching or strategy adjustments may be needed.
- For Sales Reps: Get real-time feedback on your forecasting accuracy, enabling you to refine predictions and improve performance over time.
- For Business Growth: More accurate forecasts lead to better resource planning, improved sales efficiency, and stronger revenue predictability.
By integrating forecast accuracy tracking into your sales review process, your team can continually refine their projections, leading to more data-driven decision-making and higher forecasting precision.